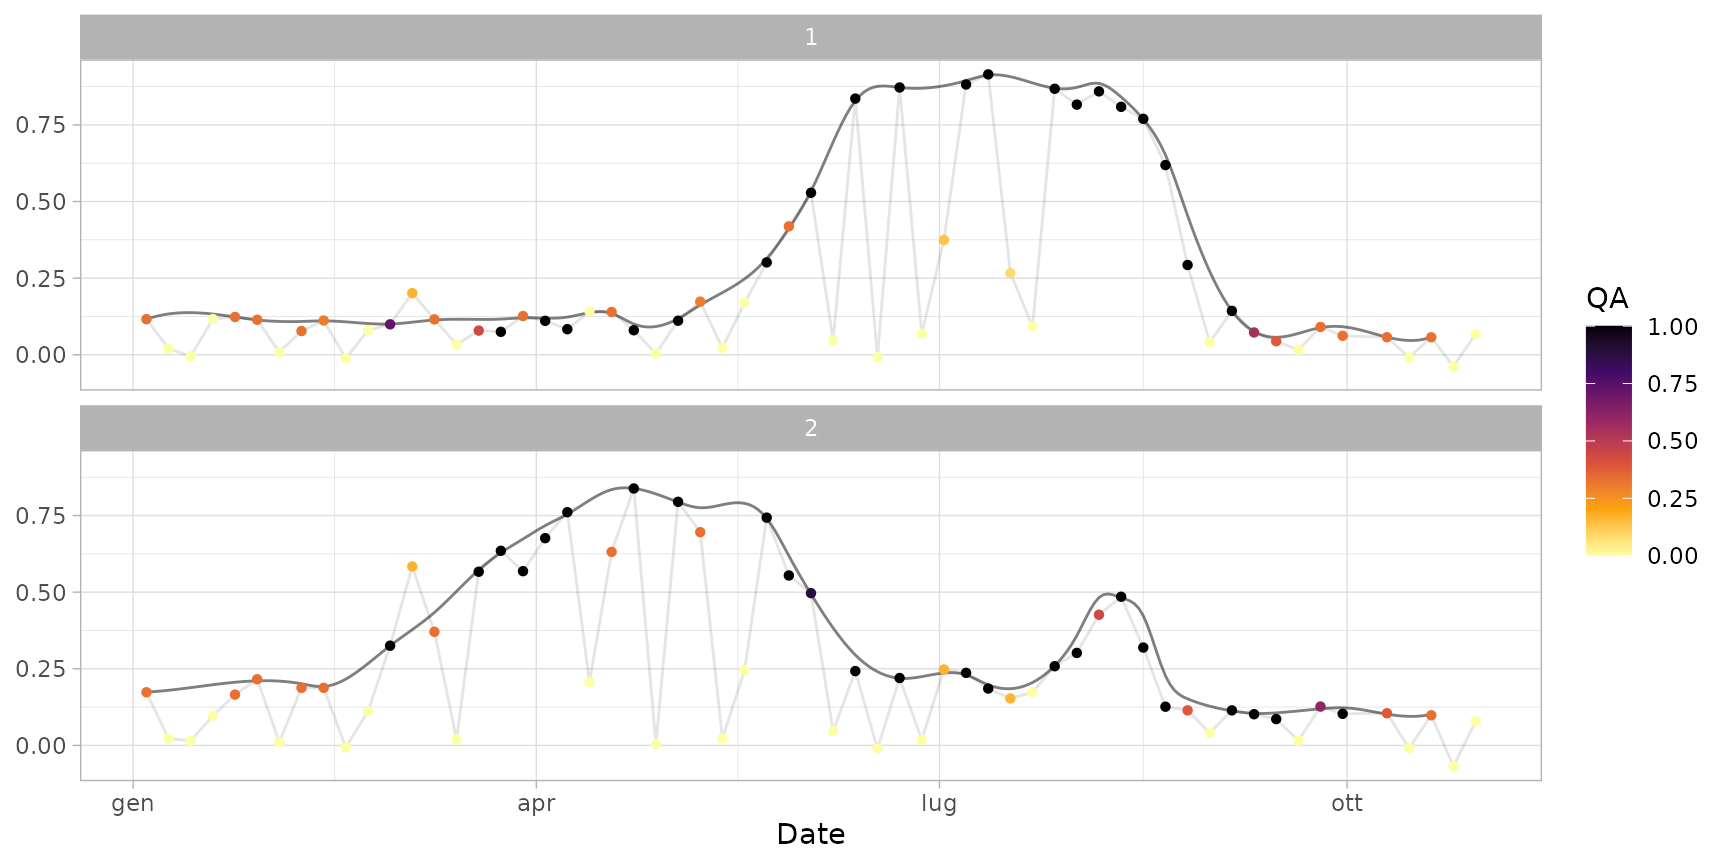
Sample time series obtained from the dataset ts_smoothed,
created following the example provided in the fill_s2ts()
documentation.
It is used in the documentation of functions with takes a processed
time series as input, like cut_cycles(), fit_curve() and
aggregate_pheno().
data(ts_filled)Format
A s2ts object with 301 dates (in the period 2020-01-01 to
2020-09-30) and 2 IDs (corresponding to sampleroi polygons).
Examples
data(ts_filled)
print(ts_filled, topn = 5) # standard print
#> An interpolated s2ts time series with 301 dates and 2 IDs.
#>            Date Orbit Sensor         1            2
#>   1: 2020-01-04   022     2B 0.1160602 ○  0.1740709 ○
#>   2: 2020-01-05  <NA>   <NA> 0.1207222 ~  0.1749062 ~
#>   3: 2020-01-06  <NA>   <NA> 0.1247380 ~  0.1759228 ~
#>   4: 2020-01-07  <NA>   <NA> 0.1281397 ~  0.1771040 ~
#>   5: 2020-01-08  <NA>   <NA> 0.1309599 ~  0.1784328 ~
#>  ---
#> 297: 2020-10-26  <NA>   <NA>        NA ~         NA ~
#> 298: 2020-10-27  <NA>   <NA>        NA ~         NA ~
#> 299: 2020-10-28  <NA>   <NA>        NA ~         NA ~
#> 300: 2020-10-29  <NA>   <NA>        NA ~         NA ~
#> 301: 2020-10-30   022     2B        NA ~         NA ~
#>
#> Quality flags:  ● [1]  ◕ [0.9,1)  ◑ [0.75,0.9)  ◔ [0.5,0.75)  ○ [0,0.5)
#> Interpolated values are marked with "~".
head(as.data.frame(ts_filled)) # see content
#>   id       date orbit sensor     value   qa     rawval interpolated
#> 1  1 2020-01-04   022     2B 0.1160602 0.33 0.11613333        FALSE
#> 2  1 2020-01-05  <NA>   <NA> 0.1207222   NA         NA         TRUE
#> 3  1 2020-01-06  <NA>   <NA> 0.1247380   NA         NA         TRUE
#> 4  1 2020-01-07  <NA>   <NA> 0.1281397   NA         NA         TRUE
#> 5  1 2020-01-08  <NA>   <NA> 0.1309599   NA         NA         TRUE
#> 6  1 2020-01-09   022     2A 0.1332310 0.00 0.02017083         TRUE
plot(ts_filled)