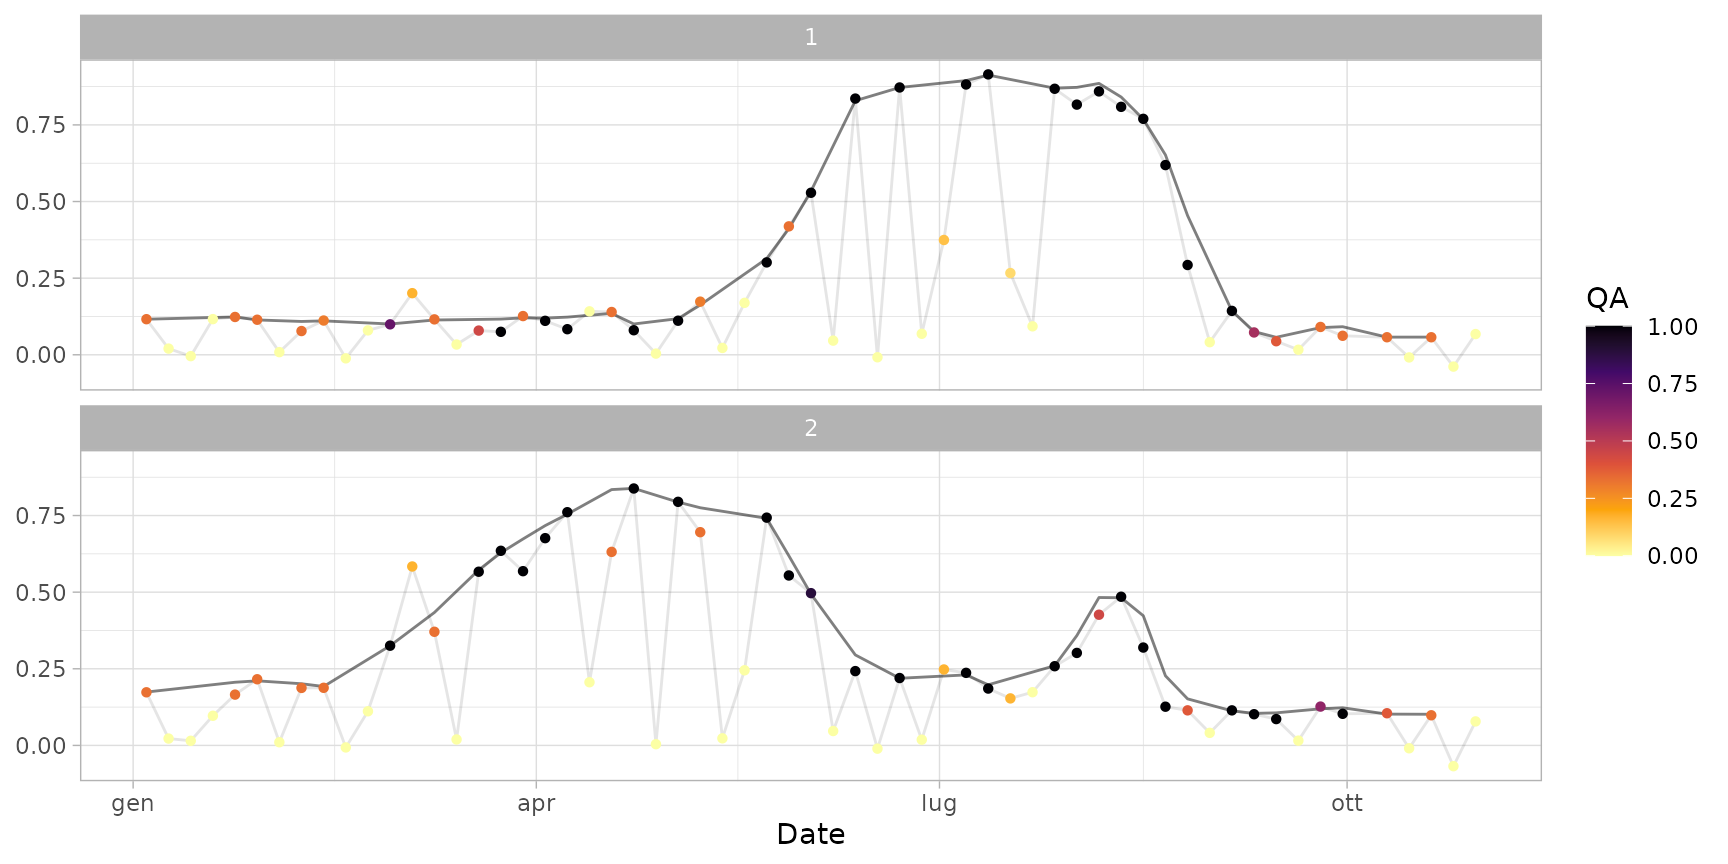
Smooth time series extracted with function extract_s2ts()
using a Savitzky-Golay filter.
Quality flags associated to the time series are used to obtain better
results.
Argument values should be manually set to obtain a correct smoothing.
smooth_s2ts(
  ts,
  min_qa = 0.2,
  noise_dir = "low",
  spike = 0.25,
  spike_window = 5,
  sg_daywindow = 15,
  sg_polynom = 2,
  sg_n = 3,
  max_extrapolation = 0.1
)
Arguments
- ts
Time series in
s2tsformat (generated usingextract_s2ts()).- min_qa
(optional) minimum 0-1 quality value (points with
qa < min_qaare not used, whileqavalues in the rangemin_qato 1 are reshaped into the range 0 to 1). Default is 0.5.- noise_dir
Direction of points generally containing noise. If
"low", higher values are generally maintained (this is the case of most vegetation indices like NDVI); if"high", lower values are generally maintained; if"undefined"(default), no assumptions are done.- spike
Relative "y" difference for spike determination (default is 0.25). Set to NA to skip spike removal.
- spike_window
Maximum number of values for spike identification (it must be an odd number). Default is 3.
- sg_daywindow
Half-size of the time window to be used to interpolate
- sg_polynom
Argument
polynomof functionw_savgol().- sg_n
(optional) Positive integer: number of applications of the Savitzky-Golay filter. The minimum value is 1 (a single application using the weights included in
ts). Within each additional application, the weights included intsare multiplicated for the relative ranks of the difference between original and smoothed values (ifnoise_dir = "low") or between smoothed and original values (ifnoise_dir = "high"). Ifnoise_dir = "undefined", this argument is coerced to 1.- max_extrapolation
(optional) Numeric: maximum allowed extrapolation out of original range (relative value). Default is 0.1 (+10%). Set to Inf in order not to set any constraint.
Value
The output time series in s2ts format.
Examples
# Load input data
data("ts_raw")

# Smoothing time series using default parameters
ts_smoothed <- smooth_s2ts(ts_raw)
print(ts_smoothed, topn = 5) # standard print
#> A smoothed s2ts time series with 60 dates and 2 IDs.
#>           Date Orbit Sensor          1            2
#>  1: 2020-01-04   022     2B 0.11606015 ○  0.1740709 ○
#>  2: 2020-01-09   022     2A         NA ○         NA ○
#>  3: 2020-01-14   022     2B         NA ○         NA ○
#>  4: 2020-01-19   022     2A         NA ○         NA ○
#>  5: 2020-01-24   022     2B 0.12343408 ○  0.2060596 ○
#> ---
#> 56: 2020-10-10   022     2B 0.05760022 ○  0.1021135 ○
#> 57: 2020-10-15   022     2A         NA ○         NA ○
#> 58: 2020-10-20   022     2B 0.05767390 ○  0.1016156 ○
#> 59: 2020-10-25   022     2A         NA ○         NA ○
#> 60: 2020-10-30   022     2B         NA ○         NA ○
#>
#> Quality flags:  ● [1]  ◕ [0.9,1)  ◑ [0.75,0.9)  ◔ [0.5,0.75)  ○ [0,0.5)
head(as.data.frame(ts_smoothed)) # see content
#>   id       date orbit sensor     value   qa       rawval
#> 1  1 2020-01-04   022     2B 0.1160602 0.33  0.116133333
#> 2  1 2020-01-09   022     2A        NA 0.00  0.020170833
#> 3  1 2020-01-14   022     2B        NA 0.00 -0.004372917
#> 4  1 2020-01-19   022     2A        NA 0.00  0.116368750
#> 5  1 2020-01-24   022     2B 0.1234341 0.33  0.123387500
#> 6  1 2020-01-29   022     2A 0.1137065 0.33  0.114379167
plot(ts_smoothed)


# Apply a more pronounced smoothing
ts_smoothed_2 <- smooth_s2ts(
  ts_raw,
  min_qa = 0.5, # exclude values with qa < 0.5
  sg_daywindow = 30, # larger moving window
  sg_polynom = 3, # cubic interpolation
  sg_n = 5 # apply the SG filter 5 times
)
plot(ts_smoothed_2)
# Apply a more pronounced smoothing
ts_smoothed_2 <- smooth_s2ts(
ts_raw,
min_qa = 0.5, # exclude values with qa < 0.5
sg_daywindow = 30, # larger moving window
sg_polynom = 3, # cubic interpolation
sg_n = 5 # apply the SG filter 5 times
)
plot(ts_smoothed_2)
